What this standard is about....
|
8.F.2 - Compare properties of two functions each represented in a different way (algebraically, graphically, numerically in tables, or by verbal descriptions). For example, given a linear function represented by a table of values and a linear function represented by an algebraic expression, determine which function has the greater rate of change.
|
|
|
|
This is a good presentation that talks about the vertical line test and how you can use it to determine if a relation is a function. To the left you see a slide show of the video, and if you click on the YouTube video to the right, you can see the entire presentation with the explanation that goes with it.
|
|
|
We can show functions and their relationships in different forms. As you can see on the video to the left, you can graph them, you can write them as an equation, and you can also write them in a table. Watch the short video to see what they mean, how you know they are functions and the different ways to show functions.
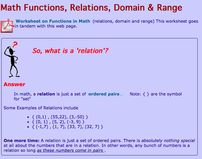
Here is a nice website from Mathwarehouse.com where you can practice determining what is the domain and what is the range.
You can also work on the assignment they have, which I have also put below. |
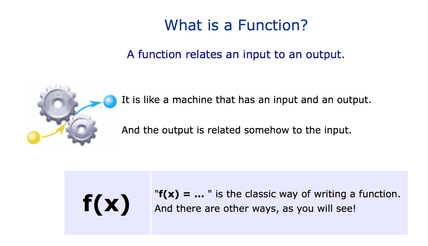
The mathisfun.com website offers quite a bit about functions. Click on the above image to take you there and learn more about functions and what they are and how to work with them.
|
