
|
8.SP.2 - Scattter Plots and Best Fit Lines - Know that straight lines are widely used to model relationships between two quantitative variables. For scatterplots that suggest a linear association, informally fit a straight line, and informally assess the model fit by judging the closeness of the data points to the line.
|
|

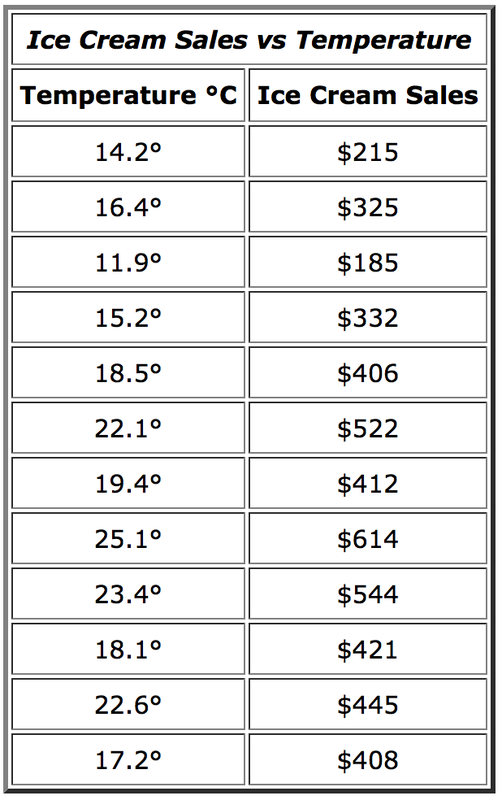
The table from 8.SP.1made this graph
|
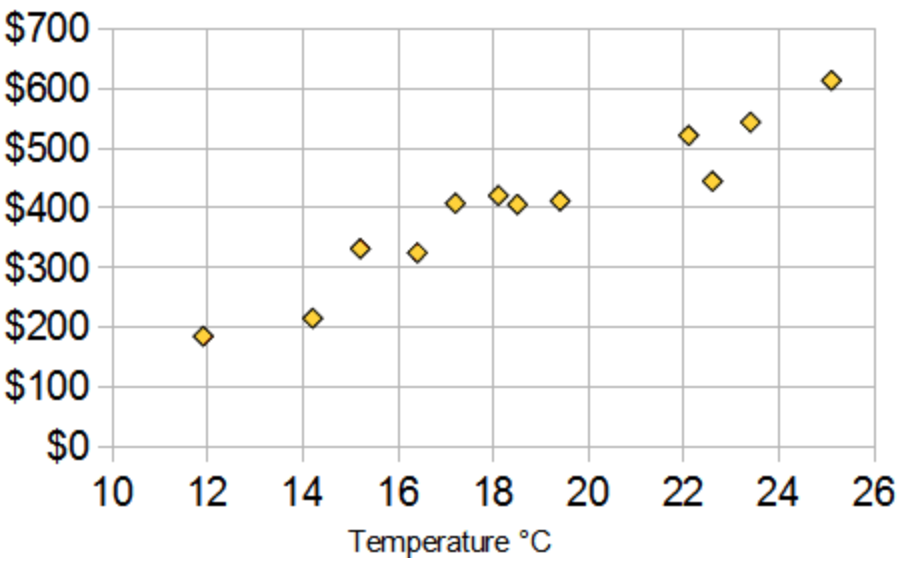
This is just the data converted to points and the points put onto a coordinate plane.
|

And this is the best fit line for the graph
|
The best-fit line sort of "splits" the data down the middle and shows a trend as to what the data would be like if you had to use a line to describe it.
|
|
This short video shows you how to estimate and draw the best-fit line for a set of data on a coordinate plane. |
|

The image above will take you to a link where you can practice finding the best-fit line for scatter plots.
|
